
What you can do
Get CRIBWISE reporting data where you need it – as a chart or table in the Admin Portal, a scheduled email, a dashboard widget or a feed for your BI tool. Pick the method that fits below, then follow its guide.
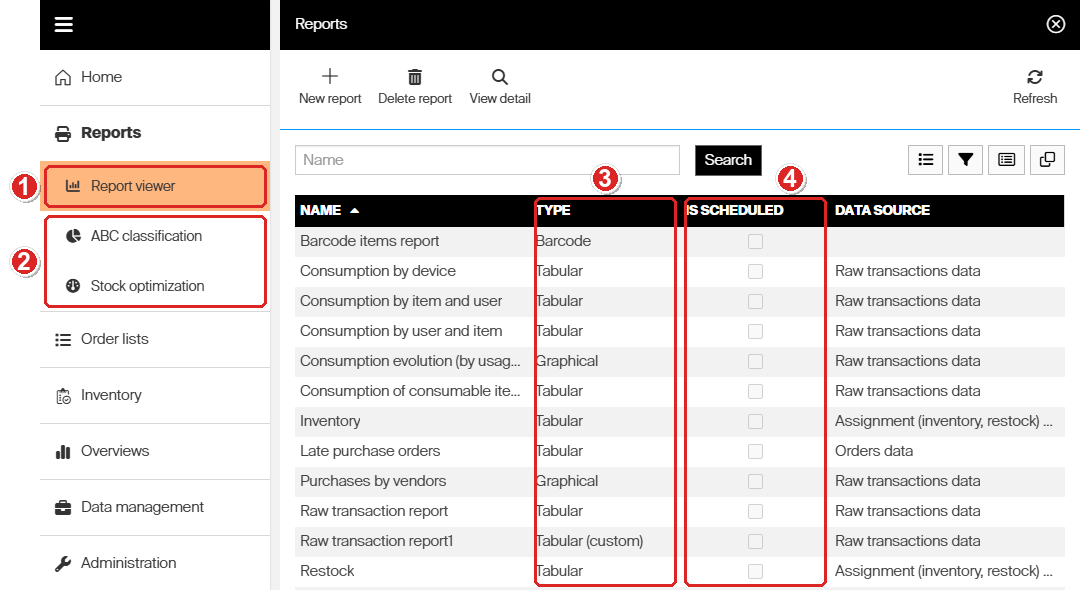
The Reports menu. (1) Report viewer opens every chart and table report. (2) ABC classification and Stock optimization are analyses with screens of their own. In the list, (3) Type tells tabular, graphical and barcode reports apart, and (4) Is scheduled marks the reports that are sent automatically.
Choose your method
| Method | Best for | Where | Guide |
| Built-in reports | Answering a common question without building anything. CRIBWISE ships 10 tabular reports, 8 chart reports and a barcode report. | Reports > Report viewer | Default reports reference: 19 built-in reports |
| Tabular reports | Reading detail row by row, grouping it with totals, or exporting it to Excel. | Report viewer, type Tabular | Understanding tabular and chart reports |
| Chart reports | Seeing a trend or a comparison at a glance. | Report viewer, type Graphical | Understanding tabular and chart reports |
| Custom reports | Your own columns, filters and grouping, when no built-in report fits. | Report viewer > New report, or Copy report on an open report | How to create a custom report |
| Export and scheduled sending | A PDF or Excel copy now, or the same report sent by email or to an FTP server at a set interval. | An open report > Export, or Edit report > Scheduler tab | How to run, filter, and schedule a pre-defined report |
| Dashboard widgets | Current status – stock level, items out of stock, device status – on the Admin Portal home screen. Any report can be pinned there too. | Home > Customize, or Pin to dashboard on an open report | How to configure dashboard widgets |
| ABC classification | Ranking items by their share of your picking cost, and writing the class to each item. | Reports > ABC classification | Understanding ABC classification |
| Stock optimization | Proposed order points and max levels, based on lead times and consumption, that you accept or adjust per item. | Reports > Stock optimization | How to optimize stock levels and order points |
| BI interface | Reading reporting data in Excel, Power BI or another OData client, for your own reports and dashboards. | Outside the Admin Portal – seven OData feeds | BI interface: connect a BI tool to CRIBWISE reporting data |
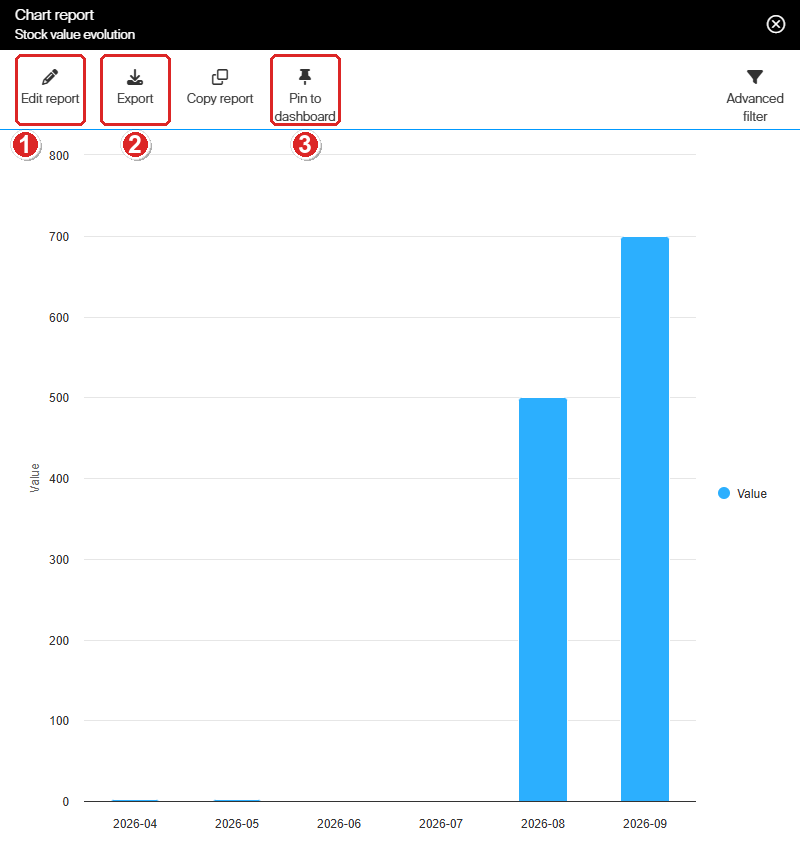
An open report. (1) Edit report holds the Scheduler tab for automatic sending – on a built-in report it is the only tab. (2) Export downloads the current view. (3) Pin to dashboard adds the report to your home screen as a widget.
Before you start
- Check your privileges. Opening a report needs Read on the Report entity privilege. Building, copying and scheduling reports also need Create and Update. The dashboard, ABC classification and Stock optimization each have a privilege of their own. See Admin Portal permissions reference.
- Know how fresh the data is. A new transaction reaches the transaction reports and the BI interface within about a minute. Reports on current stock, such as Stock location utilization, read live data. Stock value evolution reads stock history, which the system builds with a separate task.
- Pick the data source. Every report is built on one data source, and the source decides which fields the report can show. See Report data sources reference.
Tip: If a recent transaction is still missing from a report, you can start the generation yourself. Go to Administration > Tasks, select Generate data for raw transaction report and click Run. The portal answers Task enqueued. This needs the Run tasks privilege.
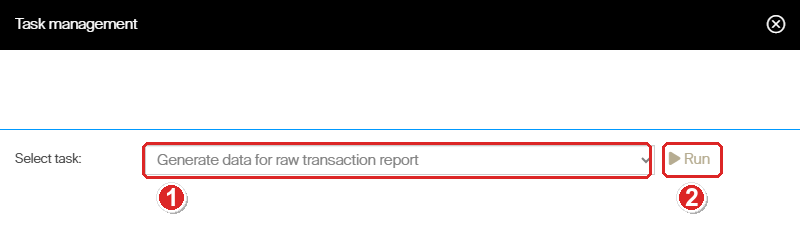
Administration > Tasks: (1) select the task, then (2) Run. Generate / update stock history data in the same list rebuilds stock history.
Important: Report data ignores restrictions on stocks, devices, vendors and items. That goes for chart and tabular reports and for the BI interface – anyone who can open a report sees every row in it. To keep sensitive data out of reach, tick Allow access only to selected reports on the group’s Data access tab, and grant report privileges only to the groups that need them. See How to create and configure a user group.
After completing
Whichever method you used:
- Set the filters – a report is only as good as its filters, and filters in the report definition also apply to every scheduled send. See How to use report filters.
- Check who can see it – review report access and privileges for the user groups involved, because restrictions on stocks and devices do not narrow report data.
Related articles
- Default reports reference: 19 built-in reports – what you get without building anything.
- How to run, filter, and schedule a pre-defined report – open, export and email a report.
- How to create a custom report – build your own chart or tabular report.
- How to use report filters – the three ways to filter a report.
- Report data sources reference – every field in every data source.
- BI interface: connect a BI tool to CRIBWISE reporting data – reporting outside the Admin Portal.