
What you can do
There is more than one way to filter a report. Which one to use depends on whether the filter should apply every time the report is opened, or only while you look at it.
| Way to filter | Where | Applies to | Use it to |
| Filters tab | Report definition | Every open and every scheduled send | Set what the report is about – period, transaction types, devices. |
| Advanced filter | Report viewer, any report | The current viewing – cleared when you close the report | Narrow a report further without changing it: tick values in the side panel, then select Apply. Clear filter removes them. |
| Inline filters | Report viewer, table reports only | The current viewing | Filter column by column, straight in the grid. |
Filters in the report viewer can only narrow what the report definition allows, never widen it. Which fields you can filter on depends on the data source the report uses.
Before you start
- The report must already exist, with a data source selected – see How to create a custom report.
- Know which data source it uses. The filters differ per source – see Report data sources reference.
Tip: As a starting point for a new report, copy a predefined report. Its filters are already set correctly.
Steps
Step 1 — Open the Filters tab
Open the report definition and go to the Filters tab. It lists the filterable fields of the report’s data source, in the order the data source defines them. The filters you set here are applied every time the report is opened in the report viewer.
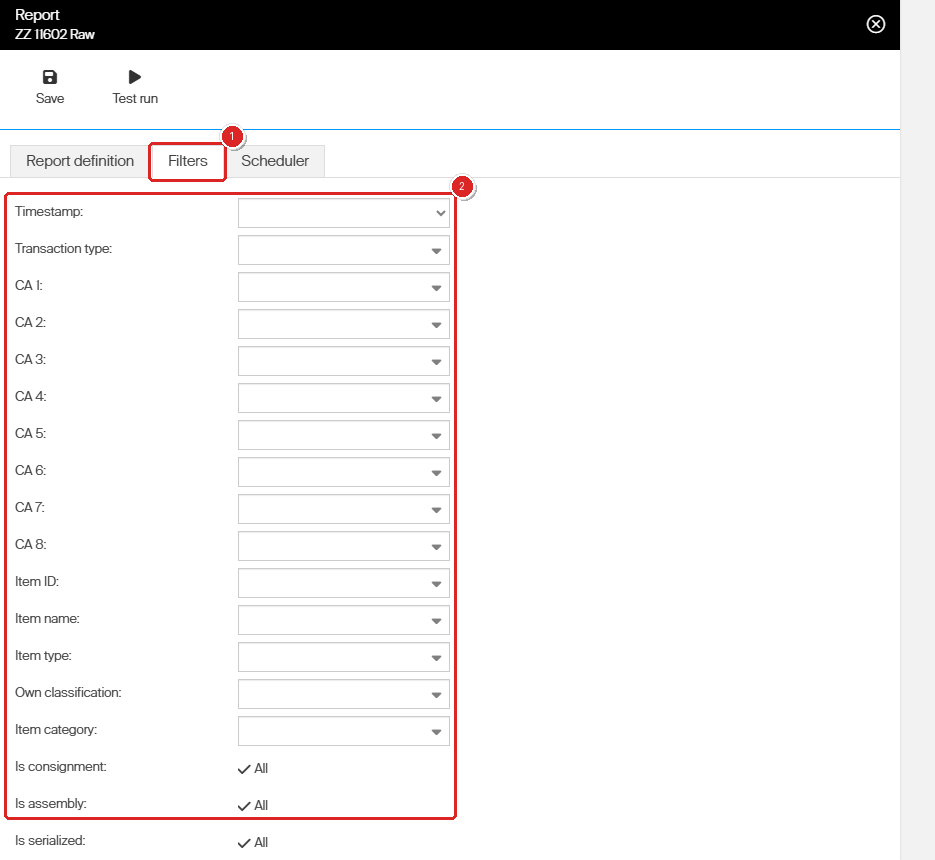
(1) The Filters tab, (2) the filterable fields of a report on Raw transactions data.
Note: The field list only appears after the first Save of a new report.
Step 2 — Set the time period
Date fields, such as Timestamp, take a period: All values, Last day, Last week, Last month, Last year, Last 24 hours, Last 5 days, Last 7 days, Last 30 days, Last 6 months, This year, This month or Custom.
Every value except Custom is dynamic: it is applied relative to the date the report is opened or sent.
Step 3 — Set the data filters
- Text and lists, such as Item ID or Device name – choose one or more values from the drop-down.
- Yes/no fields, such as Is assembly – the choice starts at All.
Available filter values come from historical or actual data. With a historical data source, a filter can therefore contain entities that have since been deleted – a removed device, for example.
Success: Opening the report in the viewer shows only the filtered data.
Important: With the transactions data source, correct filters are essential for a meaningful report. To get the total consumption of items, for example, filter to transactions of type Pick, Return and Scrap only.
Note: Filters in the report viewer – Advanced filter and inline filters – do not override the filters in the report definition. They can only narrow the data further. If the definition allows only Pick transactions, for example, Advanced filter offers only Pick, and an inline filter for Restock returns no rows.
Step 4 — Filter a table report inline (optional)
In a table report you can also filter each column straight in the report viewer. Open the report, then select Show inline filters above the grid. A filter box appears under every column header.
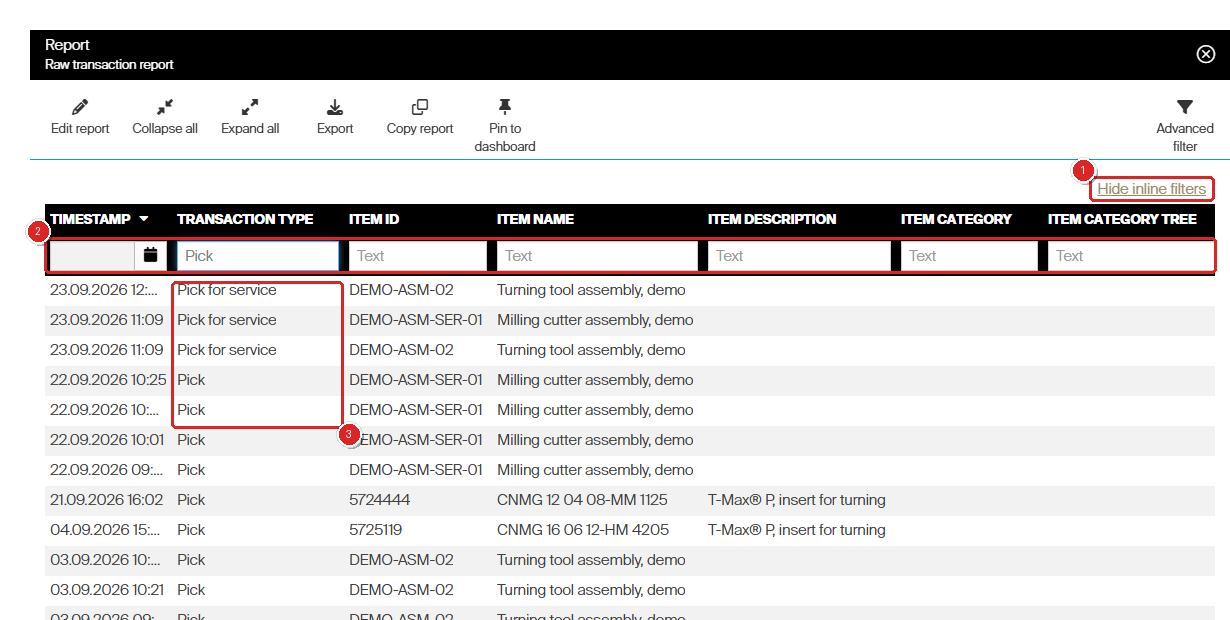
(1) Show inline filters, which reads Hide inline filters while they are on. (2) One filter per column. (3) Transaction type filtered to Pick, which also matches Pick for service.
| Column type | Example in Raw transactions data | How to filter |
| Text | Transaction type, Item ID, Device name, User login | Type part of the value. Rows that contain it are kept. A space stands for any characters: Pick service finds Pick for service. |
| Date | Timestamp | Pick a day with the calendar button. |
| Number | Quantity, Usage cost, Value | Select the operator in front of the box to switch between =, > and <, then type the number. Typing the operator into the box does not work. |
| Yes/no | Is consignment | Select the toggle to switch between All, Exclude (only No) and Only (only Yes). |
| Typing >5 in a number filter changes nothing. | The operator is not read from the box. | Select the operator in front of the box until it shows >, then type 5. |
| There is no Show inline filters link. | The report is a chart report. | Use Advanced filter, or add the filter to the report definition. |
Inline filters combine with each other and with the report definition’s filters. They are not saved: the next time the report is opened, they are empty.
Note: Chart reports have no grid and so no inline filters. Use Advanced filter instead.
Troubleshooting
| Problem | Likely cause | Fix |
| Consumption figures look far too high. | All transaction types are included, not just Pick, Return and Scrap. | Filter the transaction types on the report definition. |
| A deleted device still appears in the filter list. | The report uses a historical data source, whose values include past entities. | Expected behaviour – select the entities you want explicitly. |
| A viewer filter does not widen the data. | Viewer filters can only narrow what the definition allows. | Change the filters on the report definition. |
| A scheduled report covers the wrong period. | A fixed period was set instead of a dynamic one. | Use a dynamic value such as Last week. |
| Typing >5 in a number filter changes nothing. | The operator is not read from the box. | Select the operator in front of the box until it shows >, then type 5. |
| There is no Show inline filters link. | The report is a chart report. | Use Advanced filter, or add the filter to the report definition. |
Related articles
- How to create a custom report – the report definition these filters belong to.
- Report data sources reference – which fields and filters each data source offers.
- Understanding tabular and chart reports – how the filtered data is presented.
- Reporting overview: charts, tables, dashboards, and BI – all the ways to consume reporting data.