
What you can do
Open any CRIBWISE report, filter it down to the data you need, export it, and schedule it to be sent by email automatically. The same steps work for the built-in reports and for the custom ones your own organisation has created.
Important: This article shows the process of handling predefined reports. To be able to edit a reports fields you need to make a copy of it first or create a new one with the same data source.
Before you start
- You need Admin Portal access with the privilege to read reports. Copying and scheduling also need the privileges to create and update reports — see Admin Portal permissions reference.
- Know which data you are after. Every report is built on one data source, and the data source decides which columns and filters the report can offer. See Report data sources reference.
- Reports on transactions and history read reporting data, not live data. A new transaction reaches the transaction reports within about a minute. Reports on current stock read live data.
Important: Report data ignores restrictions on items, vendors, devices and stocks. Anyone who can open a report sees every row in it. Control this with report privileges and by limiting which reports a user group may open — see How to create and configure a user group.
Quick start
Experienced users — run and schedule a report in 5 steps:
- Open Reports > Report viewer.
- Double-click the report you want.
- Narrow the data with Show inline filters or Advanced filter.
- Click Export and choose PDF or Excel.
- For automatic delivery, click Edit report, open the Scheduler tab and switch on Send automatically.
Need more detail? Follow the full steps below.
Steps
Step 1 — Open the report viewer
- Click Reports in the sidebar.
- Click Report viewer.
The list shows every report you are allowed to open. Use the four columns to pick the right one before you open anything.
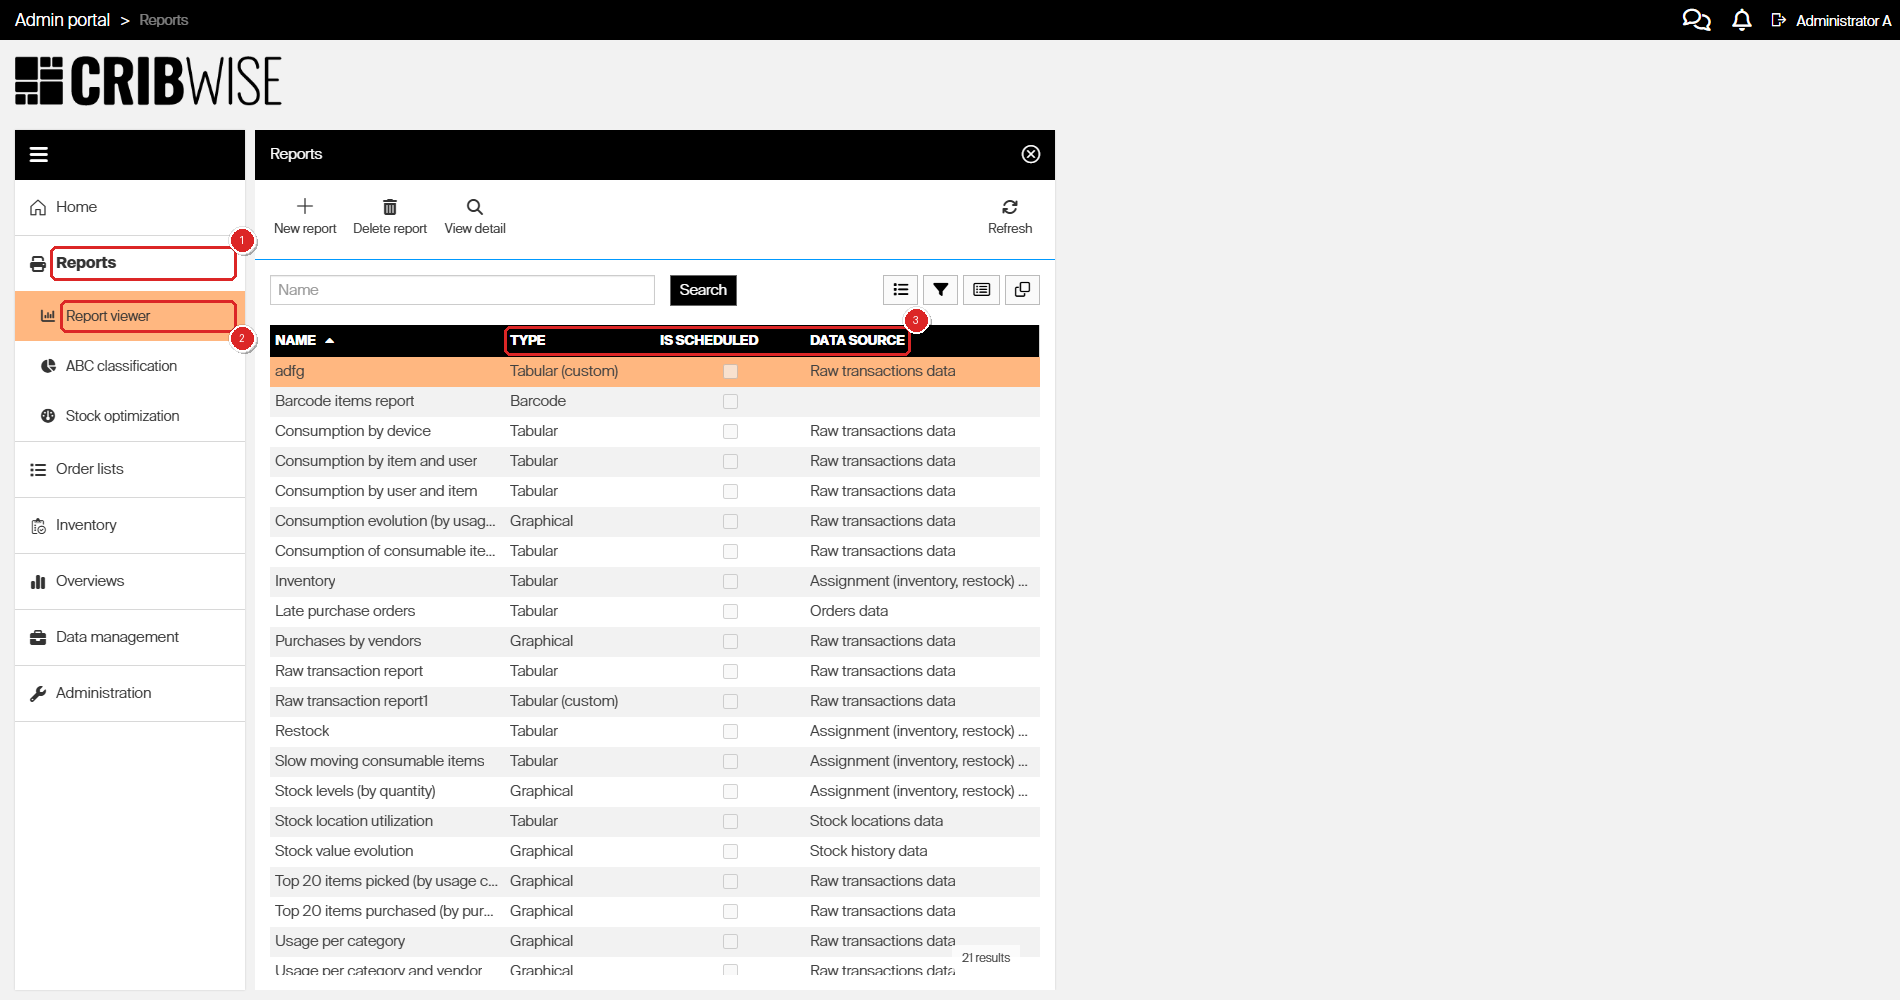
Open Reports (1) then Report viewer (2). The Type, Is scheduled and Data source columns (3) tell you what each report is.
| Column | What it tells you |
|---|---|
| Name | The report name. Type into the Name box above the list and click Search to narrow a long list. |
| Type | Tabular is a table you can group, sort and filter column by column. Graphical is a chart. Barcode is a printable barcode list. A type with (custom) after it, such as Tabular (custom), was created on your own system — those are the only ones you can edit. |
| Is scheduled | Ticked when the report is already being sent automatically. |
| Data source | Which data the report reads — for example Raw transactions data for picks and returns, or Orders data for purchase orders. The data source decides which columns and filters are available. |
Start from a built-in report rather than a new, empty one. The built-in reports already have their filters set correctly for their data source, and that is the part that is easiest to get wrong. Default reports reference lists what each one contains.
Step 2 — Open the report
- Double-click the report row. You can also select the row and click View detail.
The report opens beside the list and runs straight away, with the filters from its definition already applied. Everything you can do from here sits in the toolbar above the data.
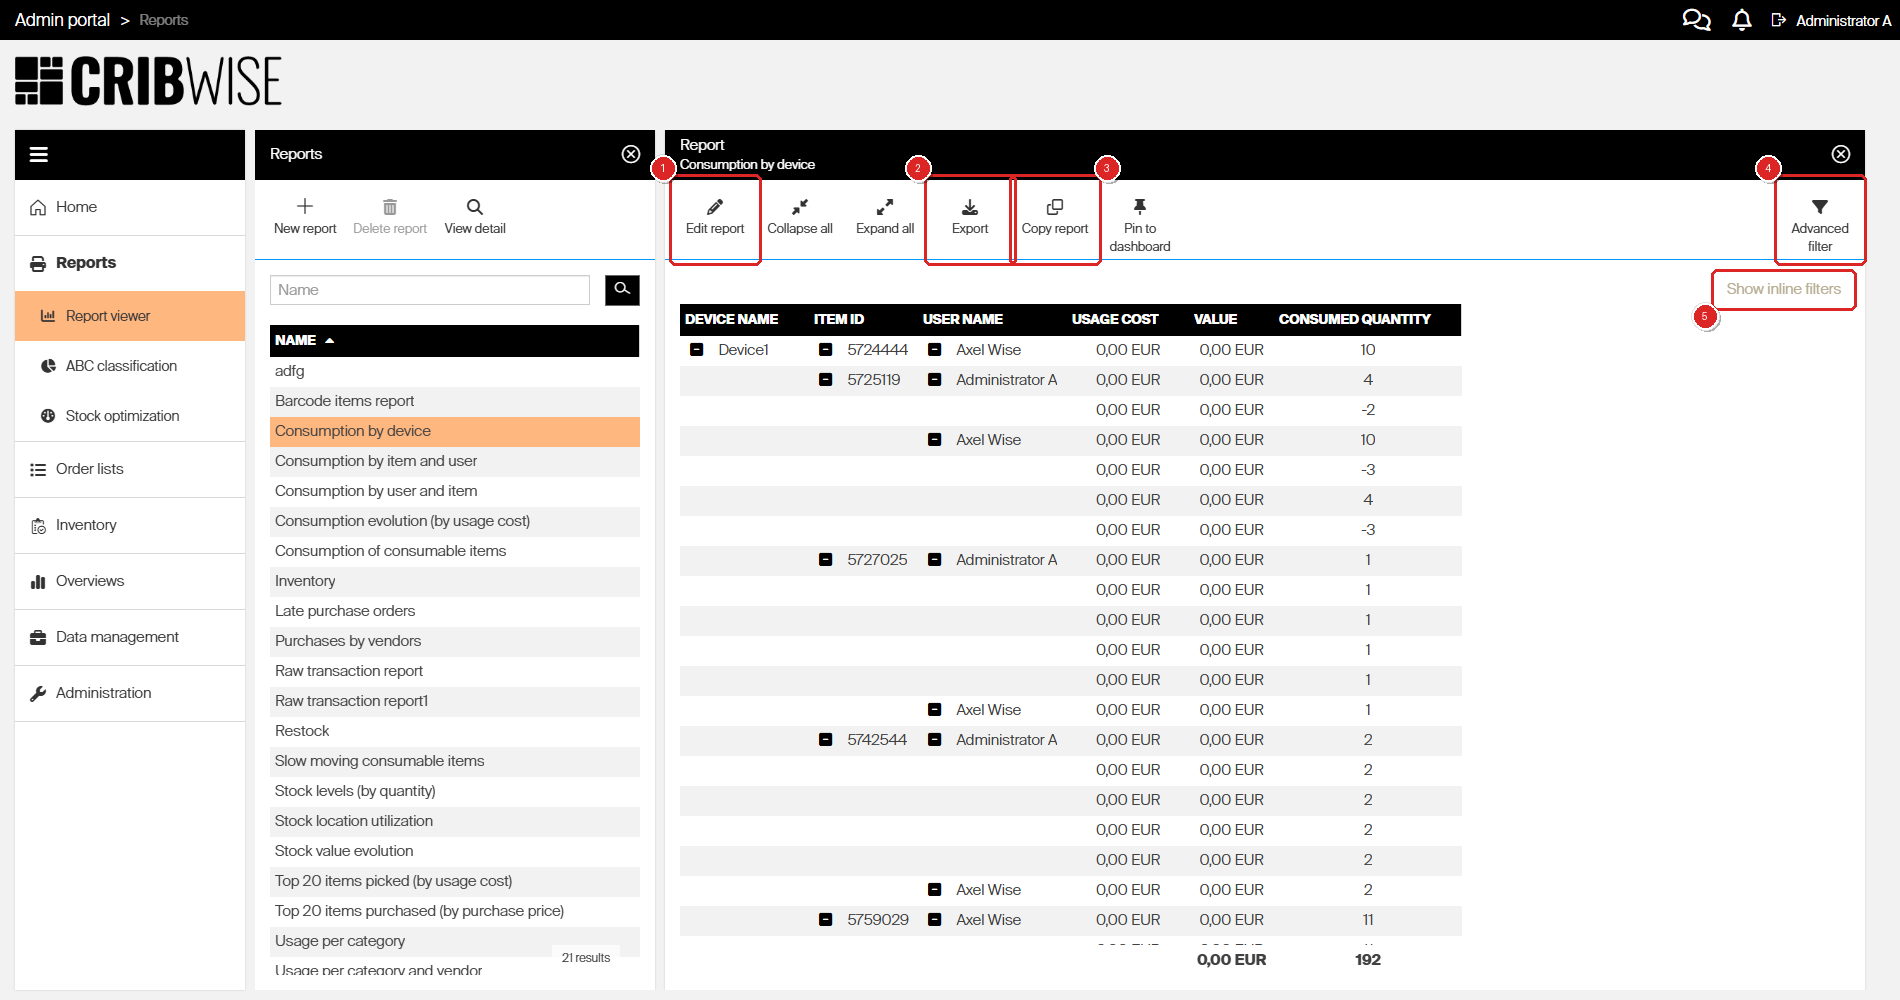
The report opens beside the list. Edit report (1), Export (2), Copy report (3), Advanced filter (4) and Show inline filters (5).
| Button | What it does |
|---|---|
| Edit report | Opens the report designer, with tabs for the definition, the saved filters and the scheduler. |
| Collapse all / Expand all | Hides or shows the rows inside each group, so you see only the group totals. Tabular reports only. |
| Export | Downloads what is currently on screen as PDF or Excel. |
| Copy report | Duplicates the report so you can change the copy. |
| Pin to dashboard | Adds the report to your Admin Portal home screen as a widget. |
| Advanced filter | Opens a filter panel covering every field the data source offers. |
| Show inline filters | Adds one filter field per column, directly above the data. Tabular reports only. |
Step 3 — Filter column by column
Use inline filters when you want to narrow one or two columns quickly.
- Click Show inline filters.
- Type into the field above the column you want to narrow.
The data narrows as you type. How the field behaves depends on what the column holds.
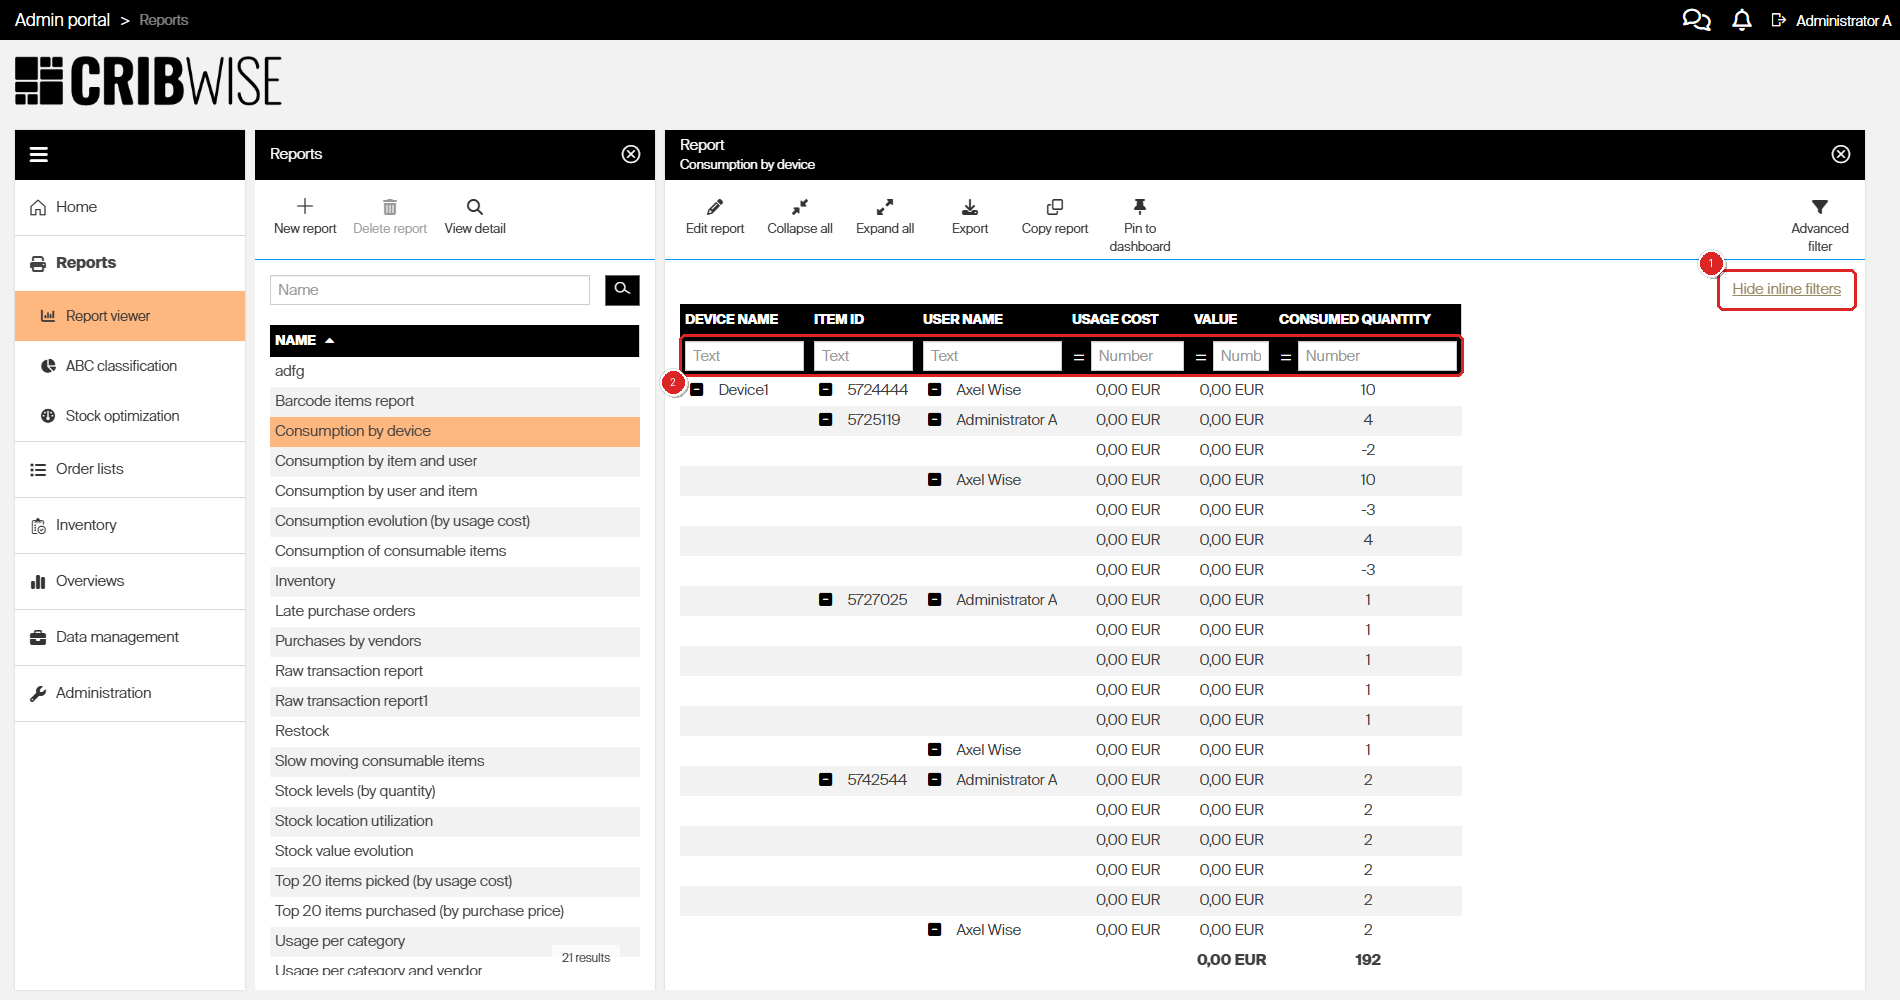
The link (1) adds one filter field per column (2) — it reads Hide inline filters while the row is showing. Text columns take free text, number columns take a value and an operator.
| Column holds | How the filter behaves |
|---|---|
| Text | Matches anywhere in the text. A blank space counts as a wildcard for any character. |
| A timestamp | Pick a single date. For a date range, use Advanced filter instead. |
| Numbers | Type a number. Click the operator icon in front of the field to switch between =, < and >. |
| Yes or no | Choose all values, true only, or false only. |
Step 4 — Filter on any field with the advanced filter
The advanced filter reaches every field the data source offers, not just the columns on screen.
- Click Advanced filter.
- Open the field you want and select the values to keep.
- Click Apply.
To start again, click Clear filter.
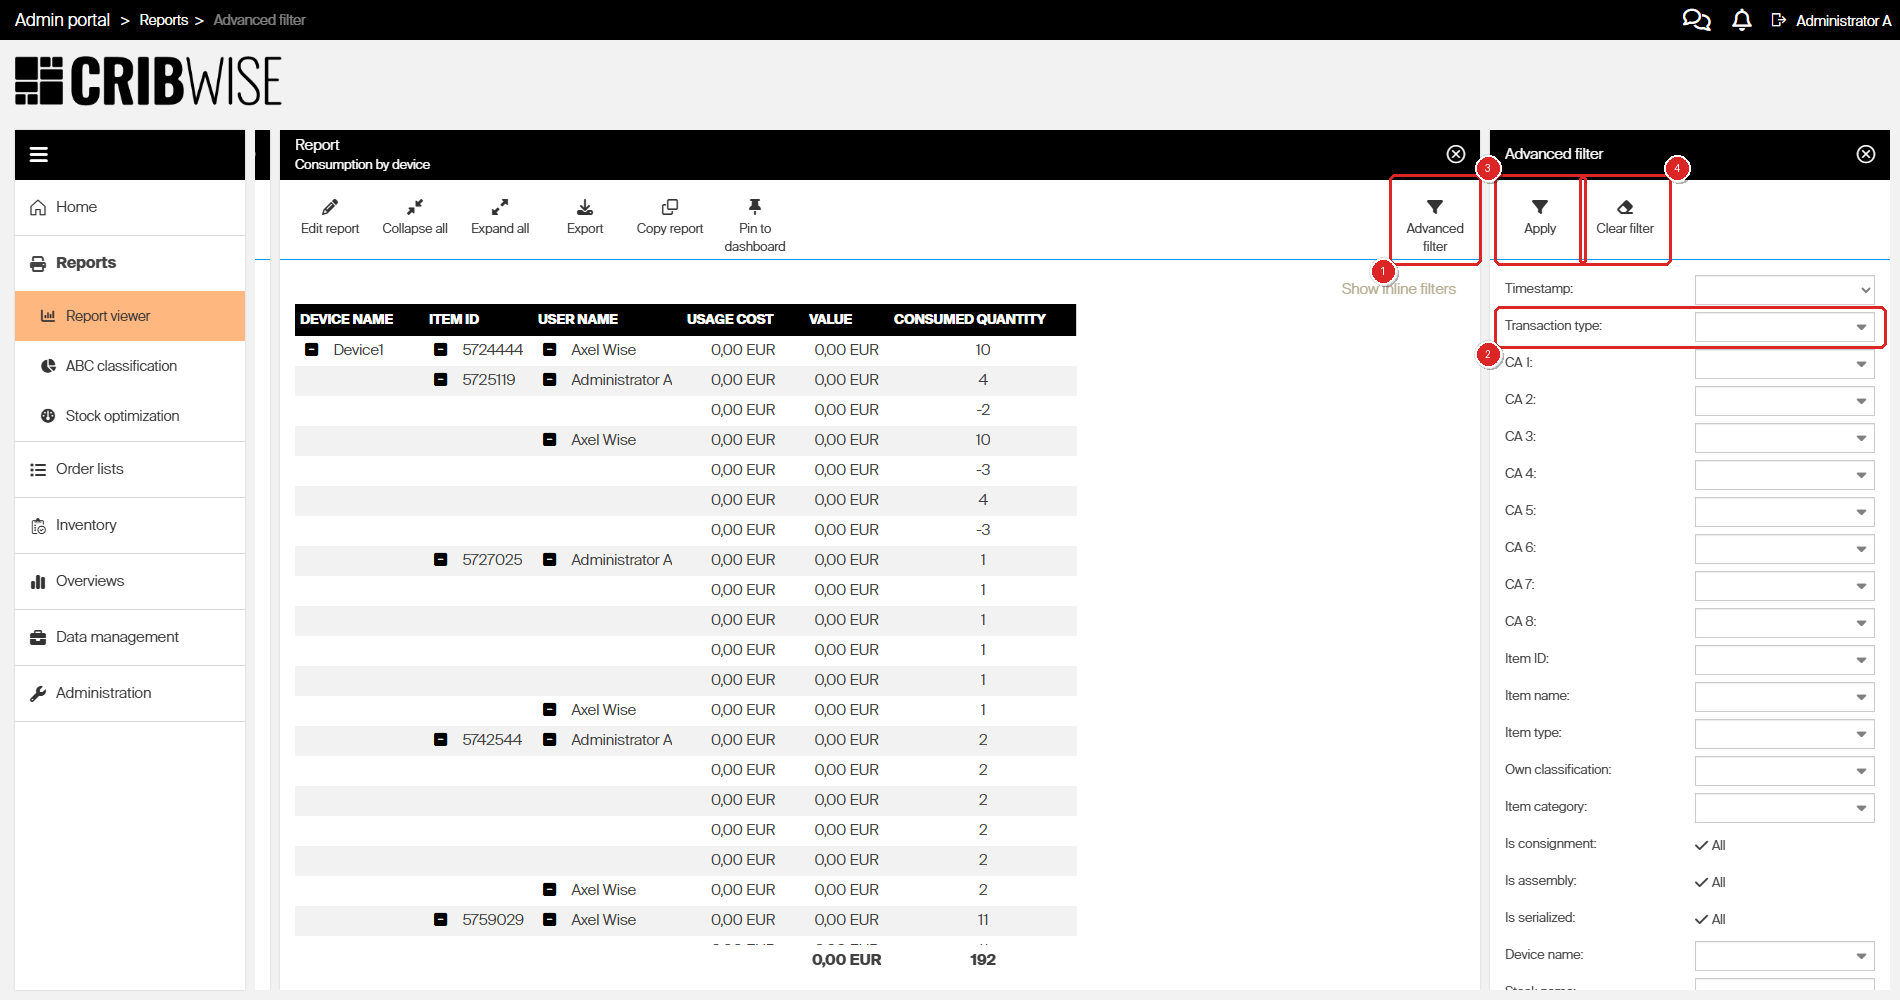
Advanced filter (1) opens a panel covering every field the data source offers, such as Transaction type (2). Confirm with Apply (3), or start over with Clear filter (4).
Note: Both filters only narrow. Neither can widen a report beyond what its definition already allows, and neither is saved — reopen the report and you are back to the definition. To make a filter permanent, put it in the report definition instead. See How to use report filters.
Step 5 — Export what you see
- Click Export.
- Choose PDF or Excel.
The file is a copy of the current view — the same columns, the same grouping and the same filters. Get the view right first, then export.
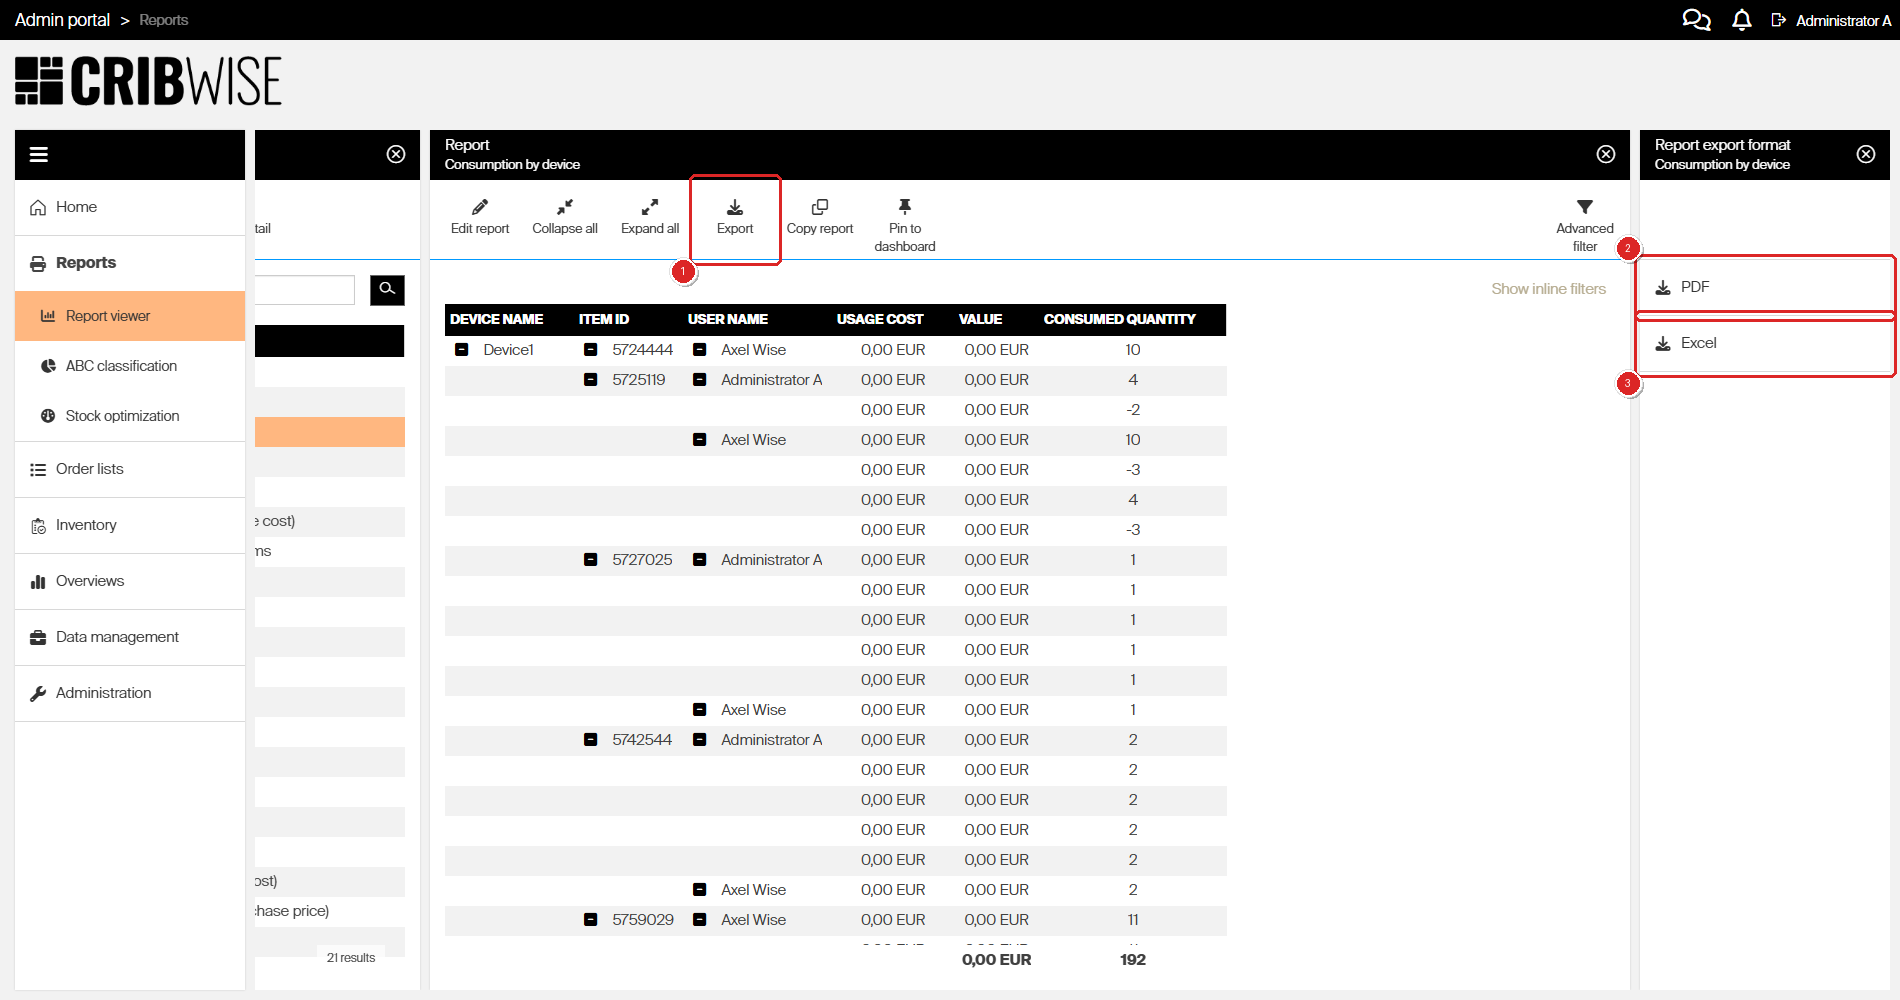
Export (1) asks for the format — PDF (2) or Excel (3). The file matches what is on screen.
Step 6 — Copy the report before you change it
Built-in reports cannot be renamed, edited or deleted. To change one, work on a copy.
- Open the report and click Copy report.
- Enter a new name. Report names must be unique.
- Add or remove columns, change the grouping, or switch the report type.
- Click Save.
Your copy appears in the report list with (custom) after its type, and the original is untouched.
For the report designer field by field, including every chart type, see How to create a custom report.
Step 7 — Schedule automatic sending
Any report can be sent on a repeating schedule, including the built-in ones.
- Open the report and click Edit report.
- Open the Scheduler tab.
- Tick Send automatically.
- Set Repeat to Once, Daily, Weekly or Monthly.
- Enter the sending Time as hours and minutes. For a weekly schedule, also tick the days to send on. The time follows the zone shown under Timezone.
- Set Format to PDF or Excel.
- Enter the recipients in E-mails.
- Click Save.
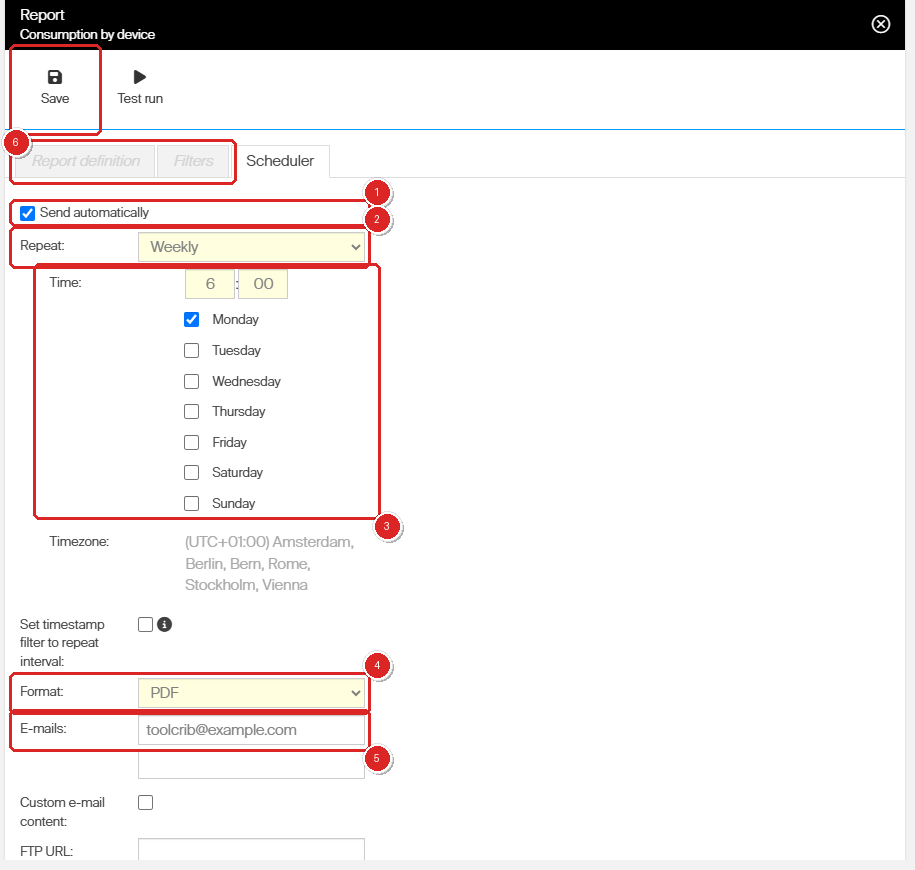
On the Scheduler tab, tick Send automatically (1), set Repeat (2), the Time and the days to send on (3), the Format (4) and the E-mails (5), then Save (6). On a built-in report the other two tabs stay greyed out.
Tip: On a report built on transactions or assignment data, tick Set timestamp filter to repeat interval. Each send then covers only the period since the previous one, so a monthly report sent on the 10th contains the data since the 10th of the month before. Any timestamp filter in the definition is ignored while this is on.
To deliver to a server instead of by email, fill in FTP URL with the Username and Password below it, tick SFTP if the server needs it, and check the details with Test connection.
Note: On a built-in report, Scheduler is the only tab you can use — Report definition and Filters stay greyed out. Make a copy first if you also need to change what the report contains.
Success: After saving, go back to Reports > Report viewer. The report’s Is scheduled checkbox is now ticked. To see the result without waiting for the first scheduled send, click Test run in the designer.
Next steps
- Keep the report in view — open it and click Pin to dashboard to add it to your home screen as a widget.
- Build a report of your own — see How to create a custom report.
- Arrange the dashboard — see How to configure dashboard widgets.
Troubleshooting
| Problem | Likely cause | Fix |
|---|---|---|
| The report is empty | A filter is excluding everything, or the report definition filters the wrong transaction types | Click Advanced filter then Clear filter, and clear any inline filters. If it is still empty, check the filters saved in the definition — see How to use report filters. |
| Today’s transactions are missing | The newest transactions have not reached reporting data yet. A new transaction takes up to about a minute to get there. | Wait a minute and reopen the report. If the transactions are still missing, go to Administration > Tasks, select Generate data for raw transaction report and click Run. The portal answers Task enqueued. This needs the Run tasks privilege. Reports on current stock, such as Stock location utilization, always read live data. |
| Show inline filters is not there | The report is a chart | Inline filters work on tabular reports only. Use Advanced filter instead. |
| In Edit report, only the Scheduler tab can be used | It is a built-in report, which cannot be changed | Close the designer, click Copy report, save under a new name, then edit the copy. |
| Saving the copy is rejected | The name is already in use | Report names must be unique. Enter a name no other report has. |
| A value you expected is missing from an advanced filter | The filter offers only values present in the data you have already narrowed to | Click Clear filter, then build the filter again from the full data set. |
| Is scheduled stays unticked | Repeat or Format was left empty, so the schedule was not saved | Both are required — they are the fields highlighted in yellow. Fill in both and save again. |
Related articles
- Reporting overview: charts, tables, dashboards, and BI — every way to get data out of CRIBWISE, including the BI interface and the Reporting API.
- Default reports reference — what each built-in report contains, so you can pick the closest starting point.
- How to create a custom report — the report designer field by field, including every chart type.
- How to use report filters — filters saved in the definition, which apply every time the report runs.
- Report data sources reference — the columns and filters each data source makes available.
- Understanding tabular and chart reports — how the two report types differ and when to use each.
- How to configure dashboard widgets — show report data on the Admin Portal home screen.