
View and analyze every pick, return, restock, and inventory transaction using the raw transaction report. Filter by date, user, item, or transaction type to track consumption, spot trends, and export data for external analysis.
Before you start
- You need Administrator or Manager access to the Admin Portal.
- Your system must have recorded transactions (picks, returns, restocks, or inventory counts) for data to appear.
Quick start
Experienced users — view raw transactions in 3 steps:
- Reports > Report viewer — open the report list
- Double-click “Raw transaction report” — the data grid loads
- Use Export, Advanced filter, or Show inline filters to refine and download data
Need more detail? Follow the full steps below.
Steps
Step 1 — Open the report viewer
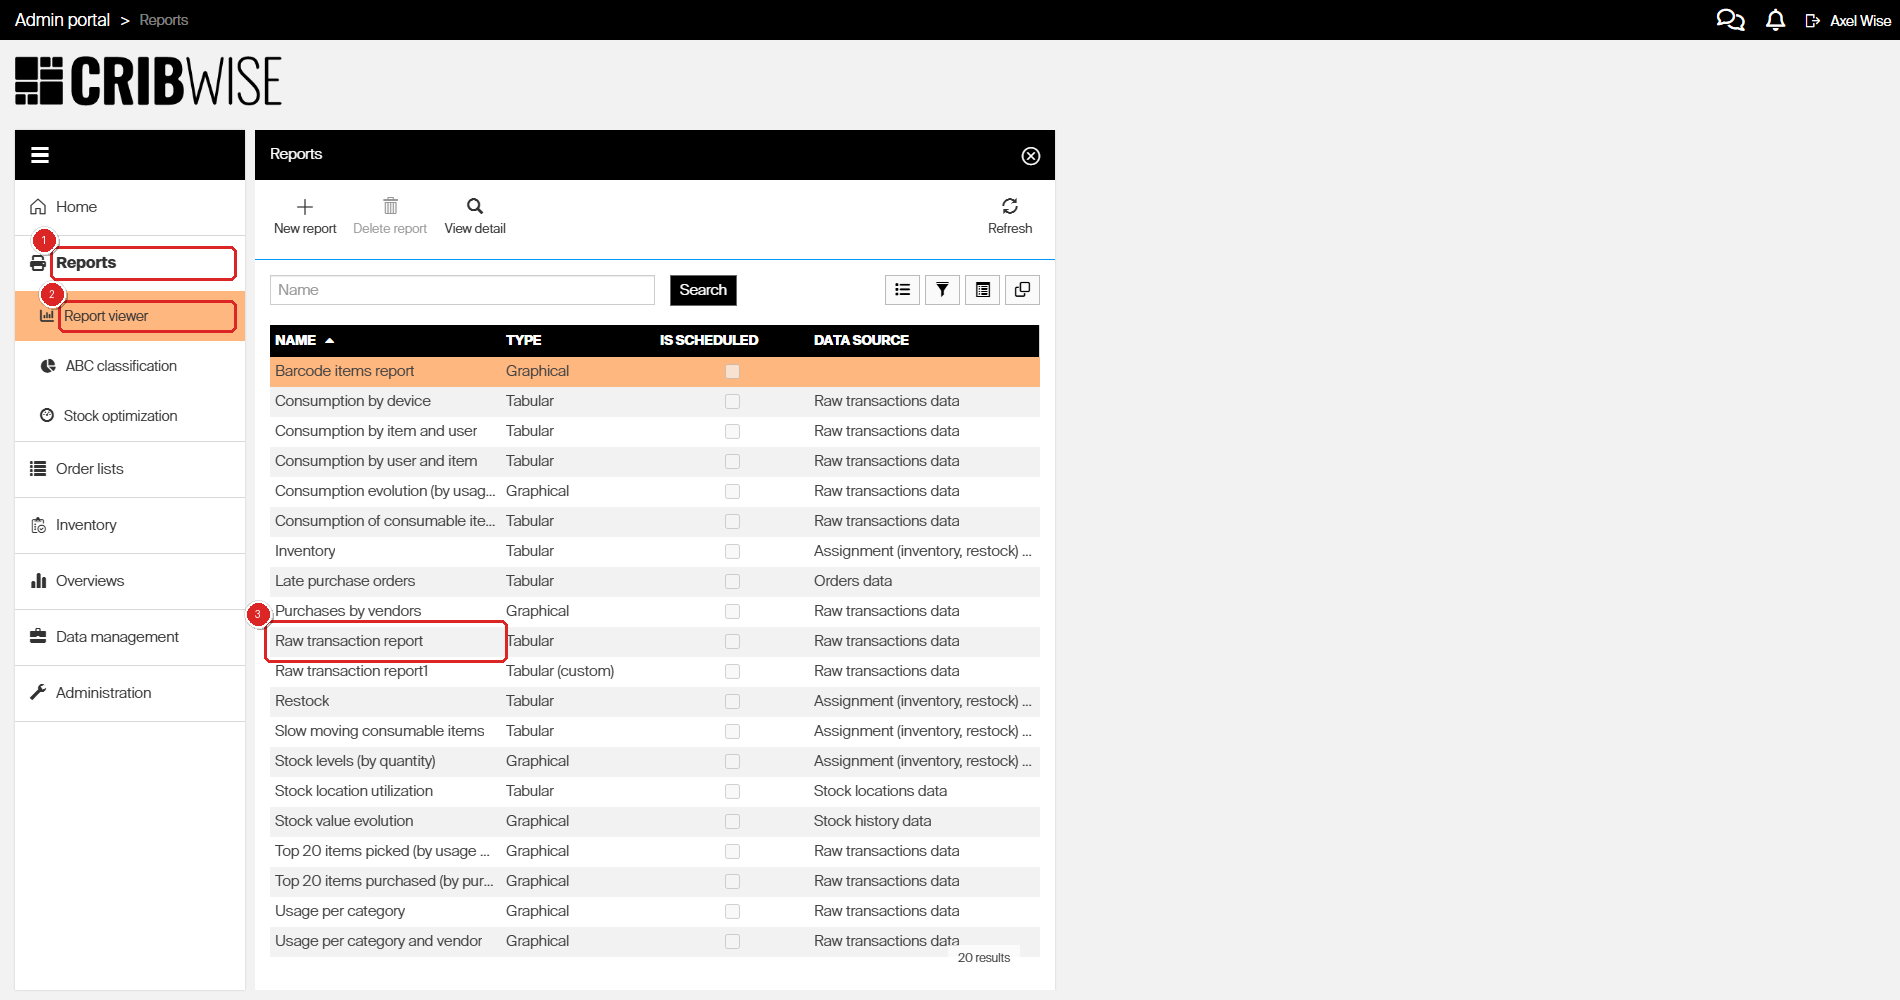
- In the left menu, click Reports.
- Click Report viewer.
The report list opens, showing all available reports. Each row shows the report name, type (Tabular or Graphical), scheduling status, and data source.
Step 2 — Open the raw transaction report
- Find Raw transaction report in the list.
- Double-click the row to open it.
The report loads and displays a data grid with your transaction history. Each row is one transaction — a pick, return, restock, or inventory count.
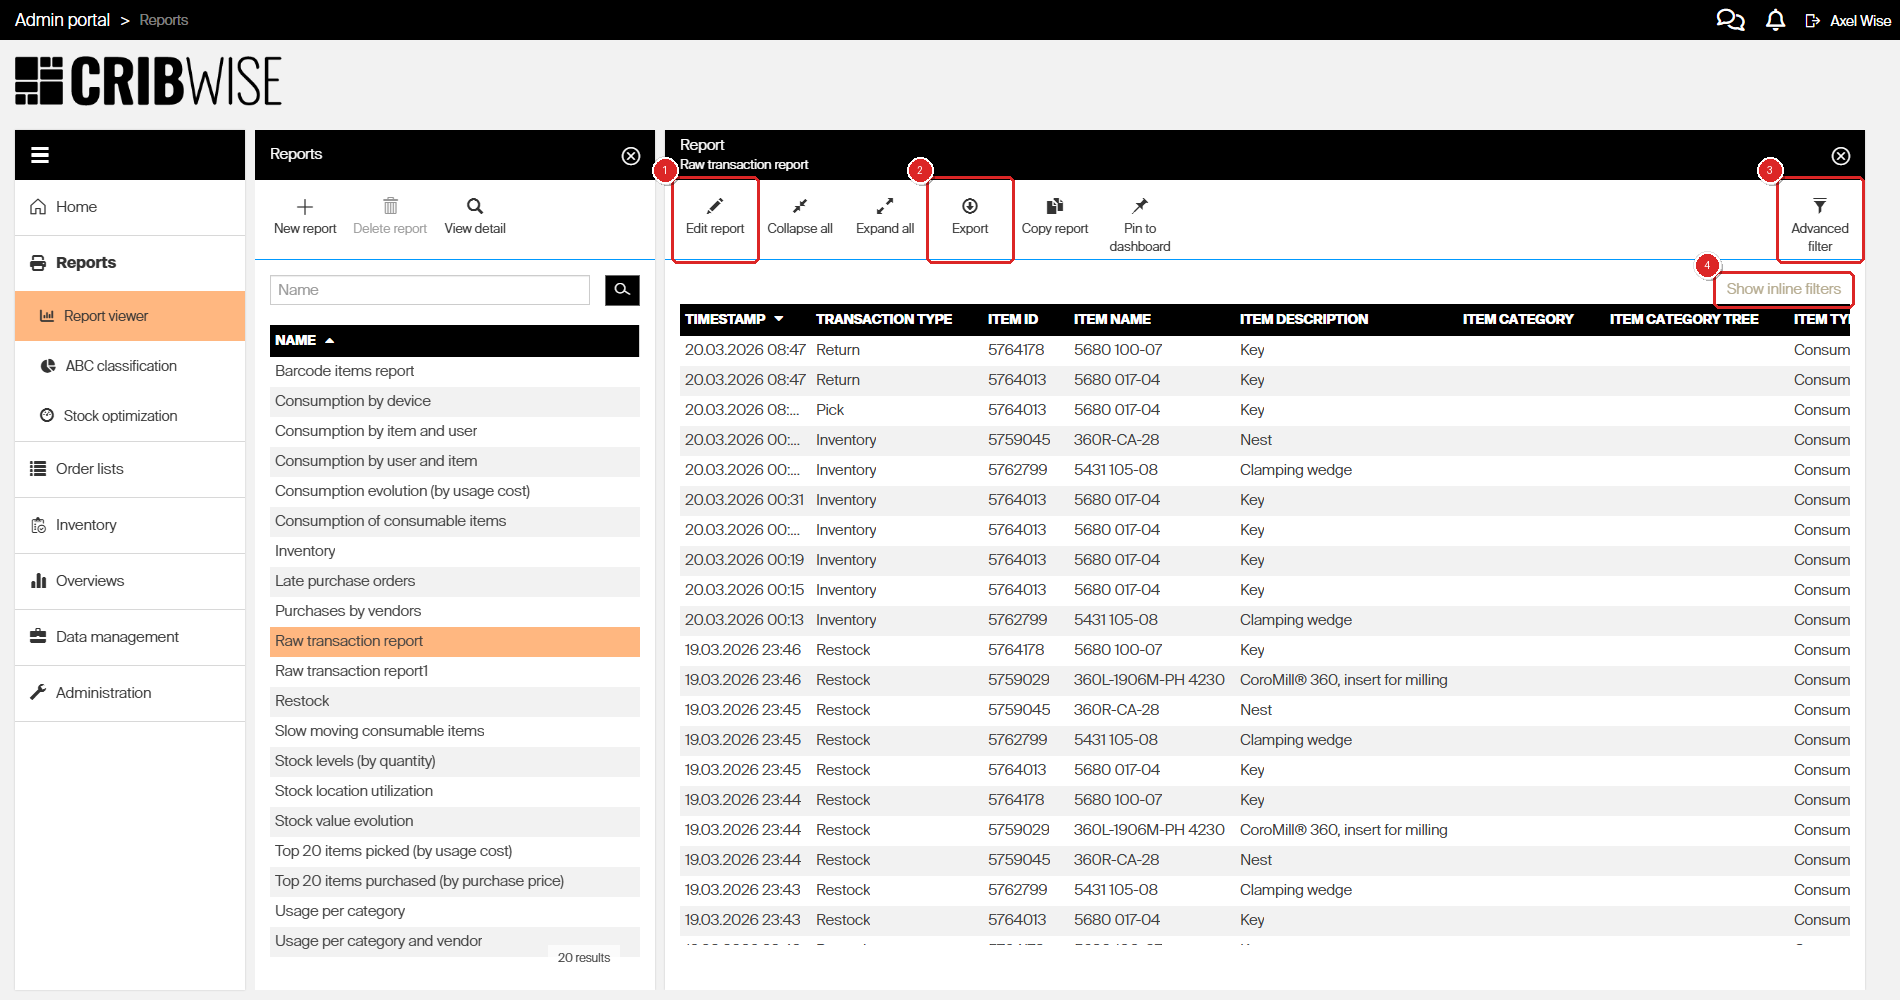
The default columns are:
| Column | Description |
|---|---|
| Timestamp | Date and time of the transaction |
| Transaction type | Pick, Return, Restock, or Inventory |
| Item ID | The unique item identifier |
| Item name | The item’s catalog name |
| Item description | Short description of the item |
| Item category | The item’s category |
| Item category tree | Full category hierarchy path |
| Item type | Consumable or Durable |
| Serial number | Serial number (for serialized items) |
| Own classification | Your internal classification code |
| Vendor ID | The vendor’s internal ID |
| Vendor name | The vendor’s display name |
Tip: If you need columns not shown here (like user name, cost allocation, or usage cost), you can customize the report. See Step 4.
Step 3 — Filter and sort the data
You have three ways to narrow down the report:
Inline filters — Click Show inline filters below the toolbar. A text box appears under each column header. Type a value to filter that column instantly.
Advanced filter — Click the Advanced filter button in the toolbar to open the filter panel. Build conditions based on column values (for example, show only “Pick” transactions or a specific date range).
Column sorting — Click any column header to sort ascending or descending. Click again to reverse the sort order.
Step 4 — Customize the report (optional)
To add or remove columns, change the data source, or switch the report type you have to make a copy of the report, or create a new one:
- Click Edit report in the toolbar.
- Select the Report definition tab.
- Adjust the settings:
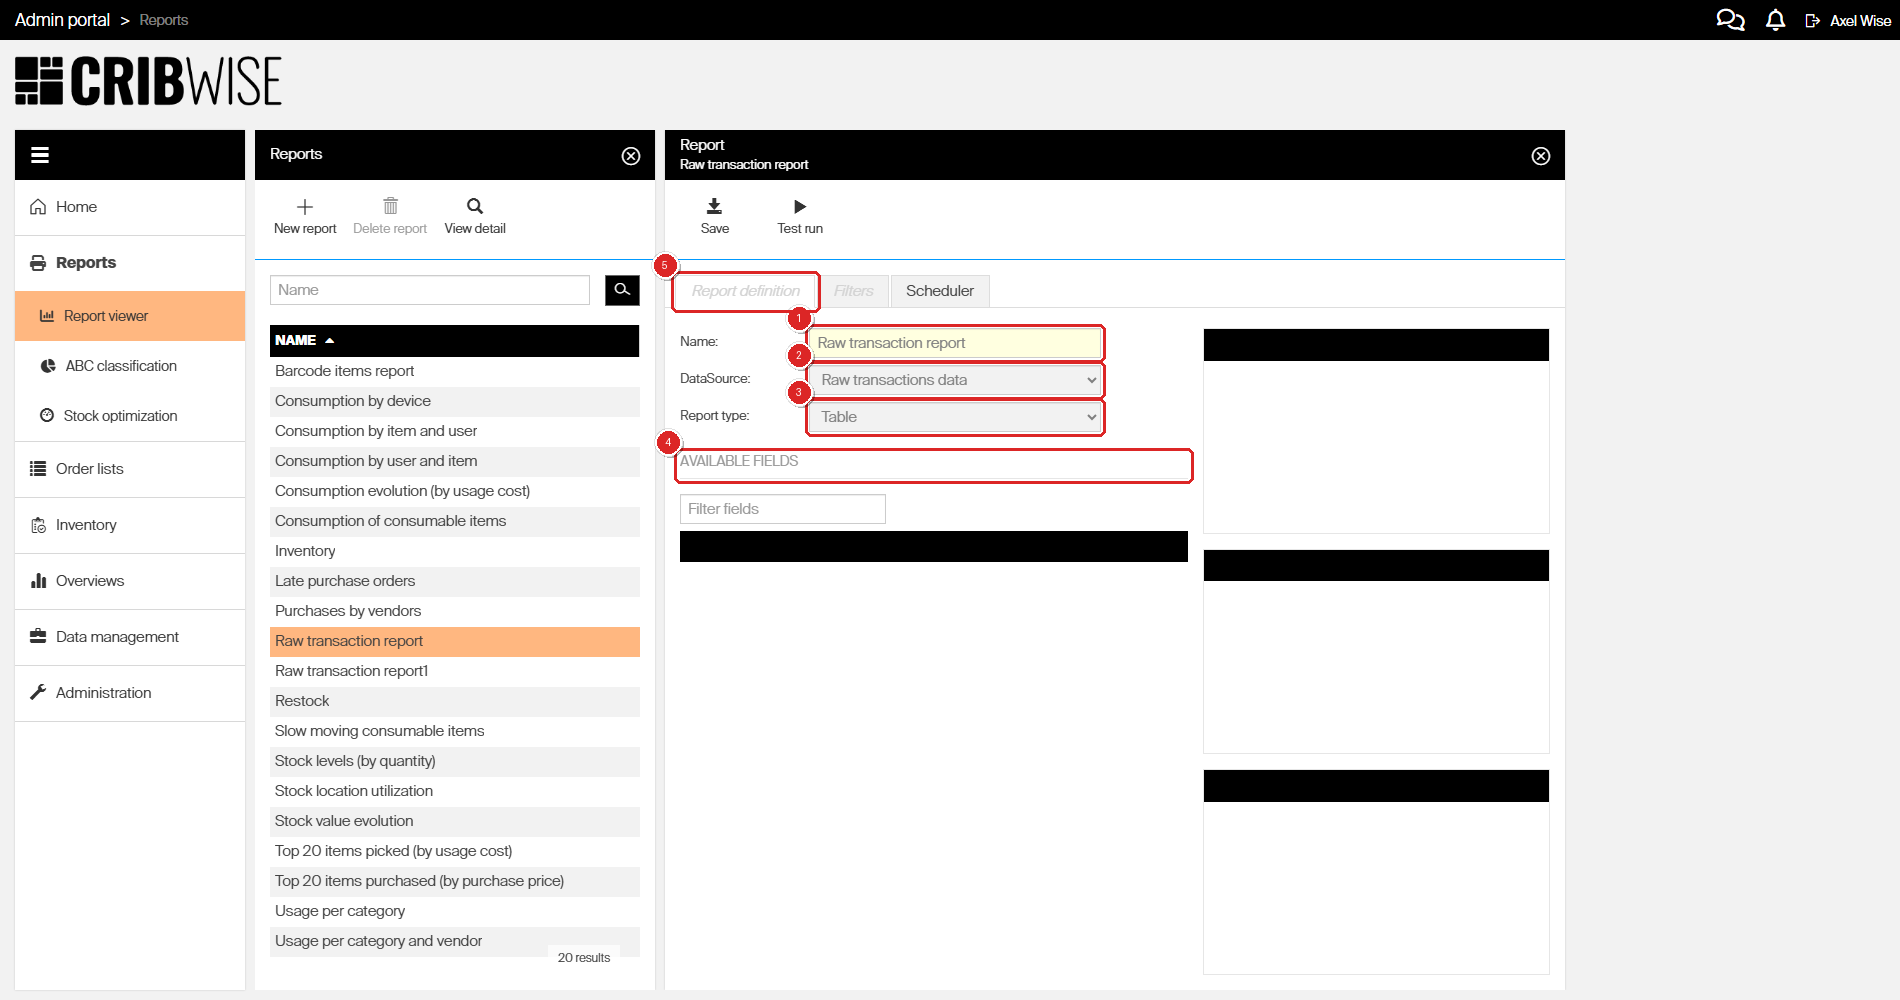
| Setting | What it controls |
|---|---|
| Name | The report’s display name, must be unique. |
| Data source | Where the data comes from. “Raw transactions data” includes picks, returns, restocks, and inventory counts |
| Report type | Table, Pie chart, Column chart, Bar chart, Line chart, or Combined chart |
| Available fields | Columns you can add to the report — drag or select fields to move them to the Columns or Group By areas |
- Click Save to apply changes.
Tip: Use Test run to preview the report with your changes before saving.
Step 5 — Export the report
- Click Export in the toolbar.
- Choose an export format.
The report downloads to your computer. Use it in Excel or other tools for further analysis.
Step 6 — Pin to your dashboard (optional)
Click Pin to dashboard in the toolbar to add the report as a widget on your Admin Portal home screen. This gives you quick access to your transaction data without navigating to the Report viewer each time.
Success: You can now view your raw transaction data in the report grid. Filter, sort, and export the data as needed. Customized columns and filters persist when you save the report.
Next steps
After viewing your transaction data:
- Create a custom report — Click Copy report to duplicate this report, then customize columns and filters for a specific use case (for example, a weekly consumption summary by device).
- Schedule automatic delivery — In the Edit report > Scheduler tab, enable Send automatically to email the report on a recurring schedule.
Troubleshooting
| Problem | Likely cause | Fix |
|---|---|---|
| Report shows no data | No transactions have been recorded yet, or the date filter excludes all records | Check that picks, returns, or restocks have been performed. Remove or widen any active filters. |
| Missing columns (e.g., user name, cost allocation) | The column is not included in the report definition | Click Edit report > Report definition and move the field from Available fields to Columns. |
| Export button does nothing | Browser pop-up blocker is preventing the download | Allow pop-ups from the CRIBWISE domain in your browser settings. |
| Report loads slowly | Large date range with many transactions | Use Advanced filter to narrow the date range, or filter by a specific item or transaction type. |
Related articles
- Reporting — overview of the CRIBWISE reporting module
- Default tabular and chart reports — descriptions of all built-in reports
- How to create a custom report — how to create and configure custom reports
- Report filters — detailed guide to setting up report filters
- Data sources — available data sources for reports