System offers to add several types of active widgets to the dashboard. Content of these widgets is described in this chapter.
Dashboard setup is always saved by user, allowing each user to define its own dashboard.
Beside default widgets, every report could be also shown on dashboard as custom widget.
To show report on dashboard, open report in report viewer and select to pin it to dashboard ( ![]() ).
).
Rearranging and sizing of custom widgets are done in same manner like for custom widgets.
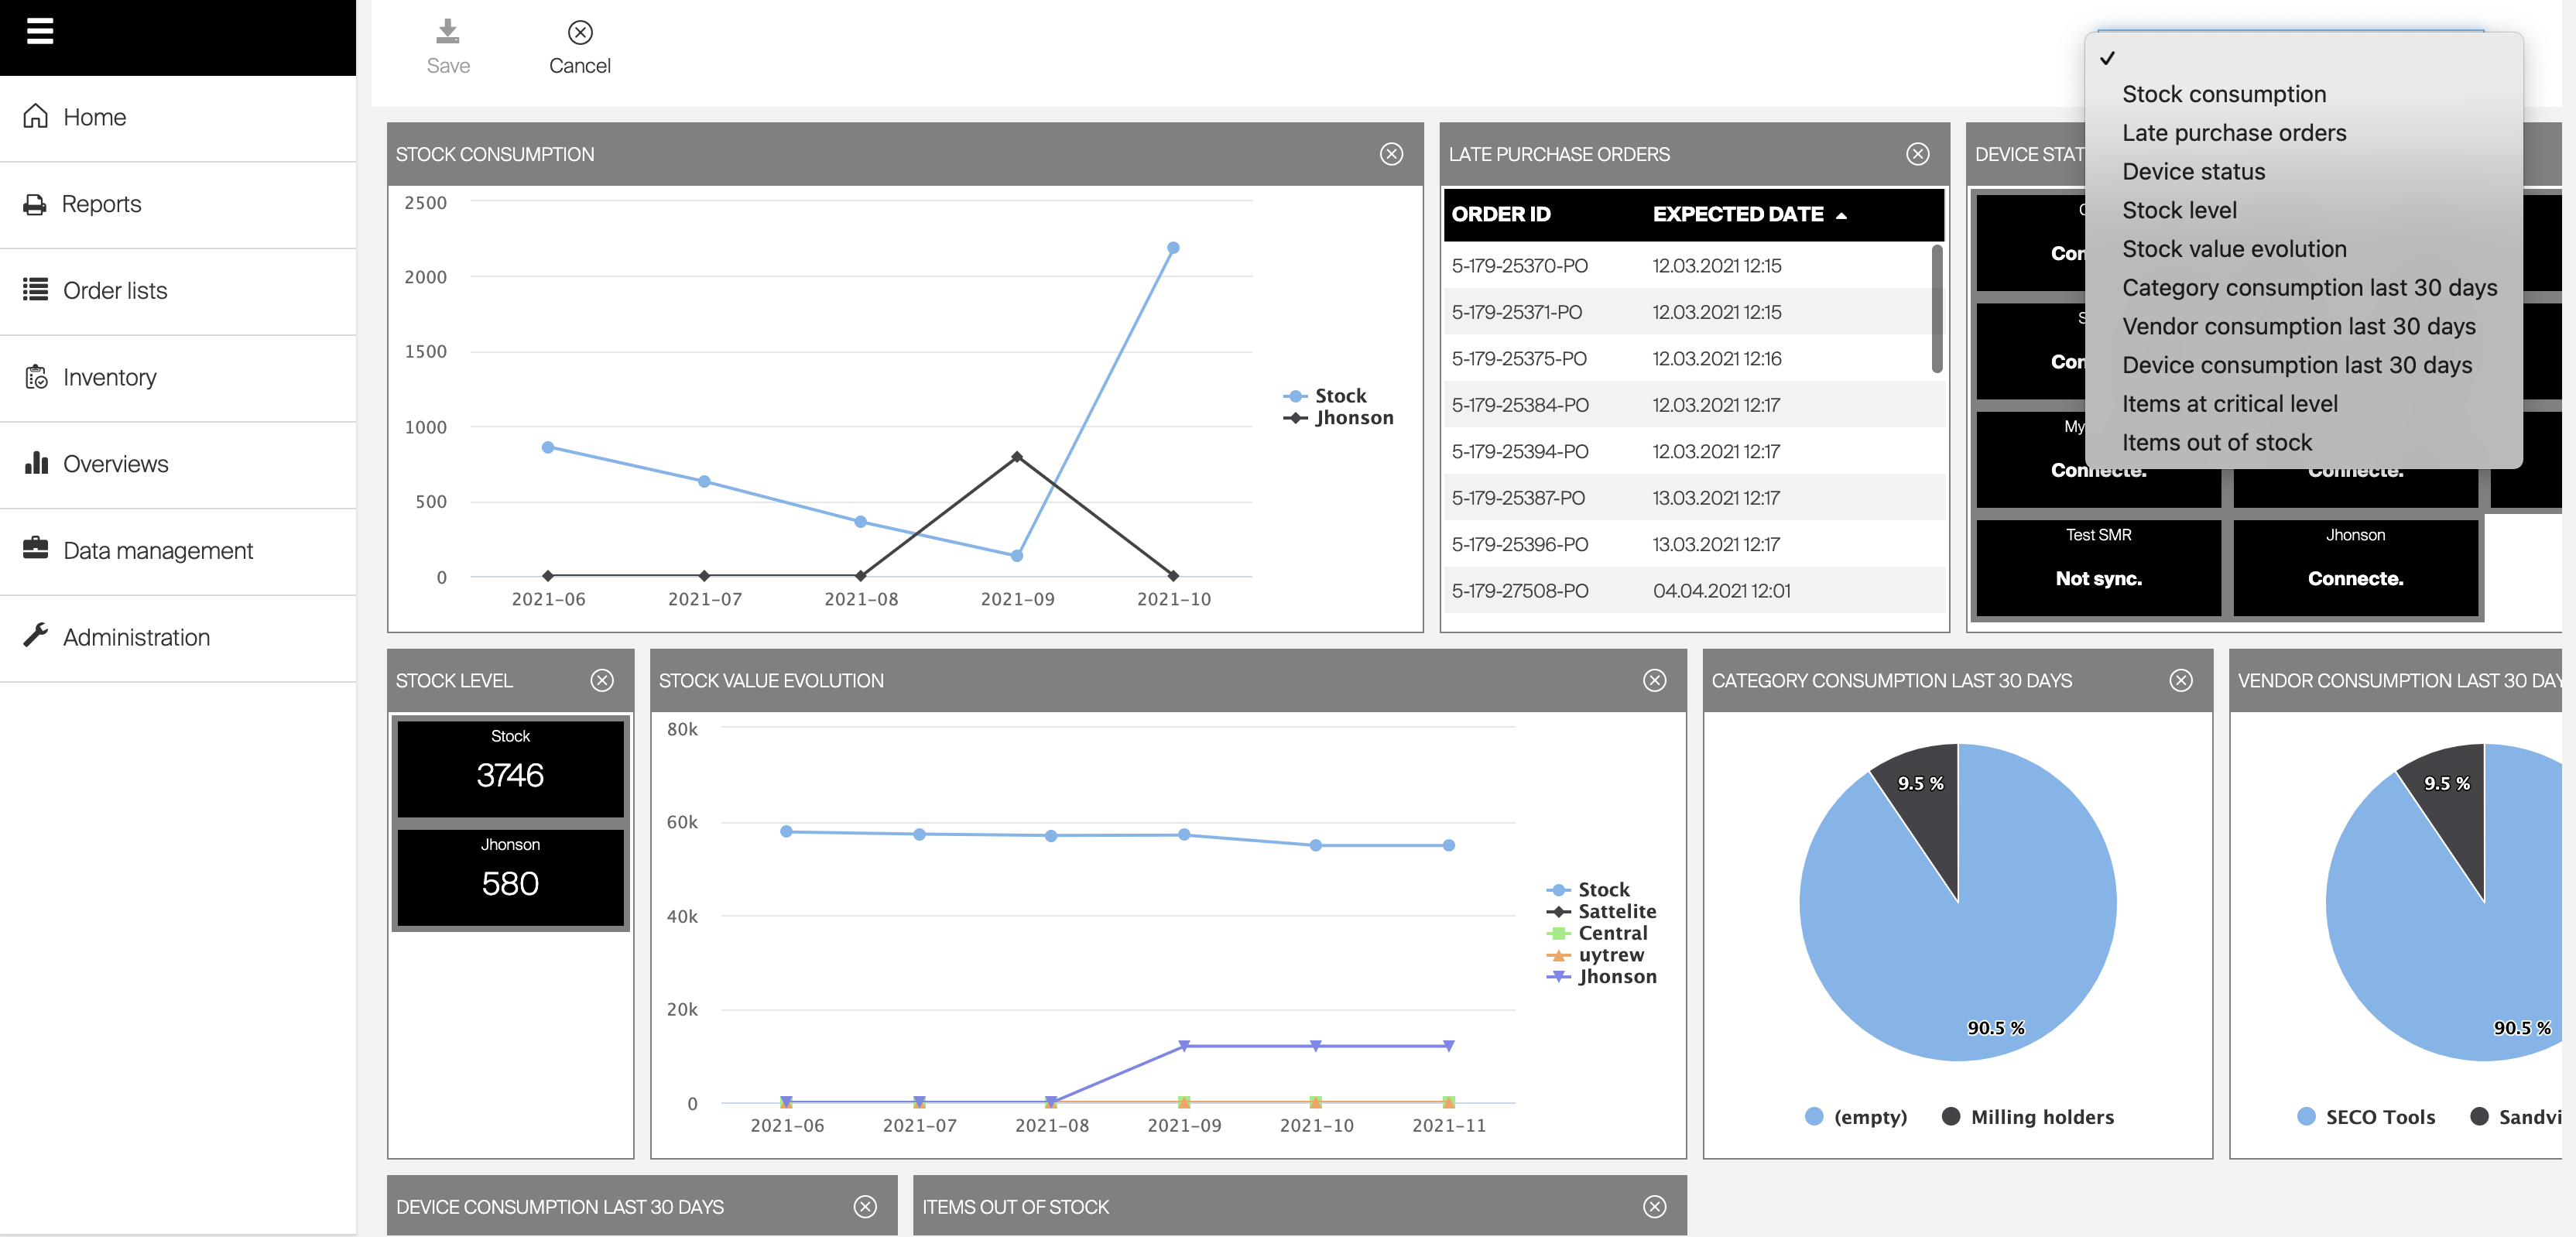
To add a default widget, press Customize ( ![]() ) button on the dashboard header section to enter edit mode and show list of all available widgets.
) button on the dashboard header section to enter edit mode and show list of all available widgets.
Then select widget from dropdown menu and confirm selection to add it to dashboard. If widget is already placed on the dashboard, existing widget is highlighted. To save changes and exit edit mode, press Save ( ![]() ) button.
) button.
To remove widget, enter edit mode by pressing Customize ( ![]() ) button on the dashboard header.
) button on the dashboard header.
Remove button with cross icon is now shown in each widget placed in the dashboard. Click ( ![]() ) button to remove widget from the dashboard.
) button to remove widget from the dashboard.
To exit edit mode press Save ( ![]() ) button.
) button.
To rearrange widgets, enter edit mode by pressing Customize ( ![]() ) button on the dashboard header.
) button on the dashboard header.
Using drag-n-drop on widget’s header rearrange your widgets on dashboard. By dragging widget’s edges size of the widget can be changed. To exit edit mode and save changes press Save ( ![]() ) button.
) button.
If browser window width is too small to show entire dashboard, all widgets are collapsed to only one column. In this state rearranging of widgets is not allowed.
Custom widgets based on reports allows to directly access report, which is the source for this widget. This could be done by pressing ![]() in widget’s title bar.
in widget’s title bar.
Items at critical level
Widgets shows number of items at or below critical state in all devices. For more information how critical state is achieved, see Item stock state. After clicking on item count, list of all items and their assignments to devices, where item is at or below critical level, is shown.
News feed
News feed widget shows feed specified in system settings. To enable news feed, turn it on in system settings and specify feed source. If news feed is not enabled, widget cannot be added to dashboard.
Late purchase orders
Widget lists all purchase orders in active state, which contain one or more items with passed expected delivery date (current date > expected delivery date).
Device status
Widget shows all devices with current statuses:
- Connected – device is online and synchronized correctly in set sync period
- Offline – device is currently not connected to AP, synchronization and lock cannot be performed
- Not synchronized – device has not been attached to any SFI yet
- Locked – device is locked and not accessible from SFI
Stock level
Widget shows list of all stocks with information about quantity of items currently located in stock locations. Picked items and items send to service are not taken in account.
Category consumption graph
Graph shows consumption (based on price per pick) per categories for last 30 days.
Vendor consumption graph
Graph shows consumption (based on price per pick) per vendors for last 30 days.
Device consumption graph
Graph shows consumption (based on price per pick) per devices for last 30 days.
Stock value evolution graph
Widget shows stock value of each stock for actual month and last 5 months. Stock value is calculated as quantity of each item currently located in stock location multiplied by each item’s standard cost.
Items out of stock
Widget lists all items assigned to stock location, which are in released or phase out state and have zero quantity in stock (picked durable items are considered as in stock; items waiting for service are not considered as in stock).