Running, Customizing, Scheduling Reports The CRIBWISE reporting function is very flexible. There are 19 stock reports which cover the most common data requests. Graphical reports assist in displaying data in standard charts without having to export and perform the charting functions within Microsoft Excel. The tabular reports can be filtered to add additional fields or group and sort data per your individual needs. This example will use the Consumption by device and add allocation values. Click on the Reports function and then Report viewer:
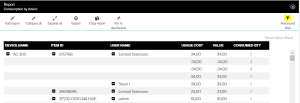
Double-click on the desired report to view and modify (in this case we will use the above-mentioned Consumption by device):
![]()
The default fields of the report are present and the Advanced filter can be clicked to add additional fields and filters. In this example the field of cost allocation will be added:
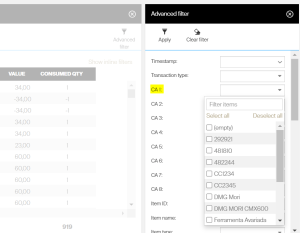
The selection of cost allocation will now filter any transactions that have the cost allocation value selected. Additionally, common filters such as timestamp, device, or vendor can all be applied to filter the desired results. The ‘Show inline filters’ can also be used to filter results for the default columns on the page. To further customize the report, clicking ‘Copy report’ will allow a duplicate to be generated without modification of the default report:
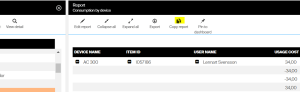
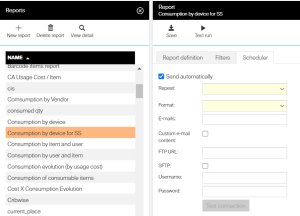
The copied report can now be customized to allow for the addition of fields and columns as well as the change of the grouping of data. Once the desired modifications have been made, the report needs to be saved. A new unique name must be chosen to allow the report to be saved. After the report has been saved, the Scheduler tab is now selectable. Clicking ‘Send automatically’ will now open scheduling options:
For more detailed information on the individual fields please see the detailed section from the help section for the Admin portal.